
The CANFDuino platform can be turned into a handy 2 port CAN/FD sniffing tool for basic monitoring bus traffic without any fancy PC side software. What’s interesting is that a very old school terminal protocol developed in the 1970’s for VT100 terminals plays a part. The ANSI X3.64 protocol provided a really simple method for manipulating cursor location and printing to the screen driven from the embedded device, (a duty that now days is implemented in PC software which can be OS and driver dependent as well as licensed). Enter modern day browsers that where terminal emulator web pages have been developed, or you can turn to the ubiquitous, free, and reliable terminal program PuTTY. Basically any PC side “terminal emulator” can be used to “CANalyze” bus traffic, agnostic of how it runs or what OS it’s on (provided USB to serial drivers). It’s not the most beautiful or elaborate solution, but hey it’s simple, easy, and cheap.
Turning CANFDuino to A Dual Port Bus Analyzer
Step 1
Read the entire GitHub readme file. Do everything in Installing the Library and First Sketch to make sure you can program your unit, it has passed testing, you have good connections, terminations etc.
Step 2
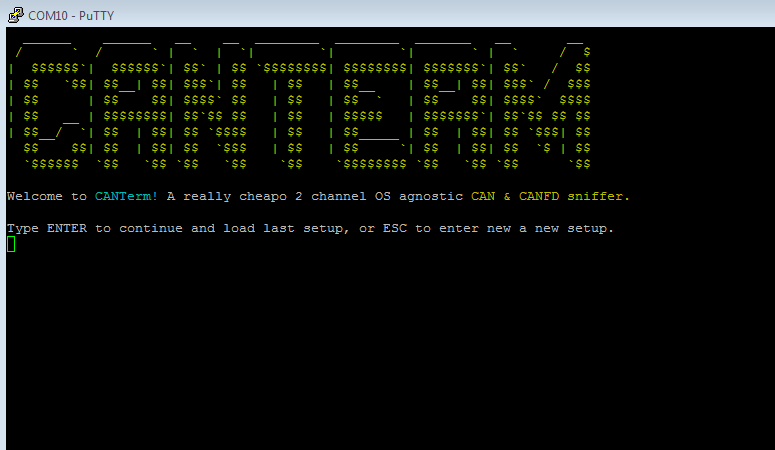
Choose your PC side terminal emulation tool. So far, we’ve only tested CAN sniffing from the browser with Google’s ChromeLabs serial terminal repository with the code found here and the actual emulator found here. If you are willing to install a small terminal program (most of you already have this) we’ve tested this with PuTTY on Windows 7 and 10.
Step 3
Make your connections to the CAN/FD bus you are sniffing and the appropriate ports on CANFDuino (CAN0 and/or CAN1). Remember to consider terminations, if the bus you are monitoring is already terminated between two devices on the network then you do not want to enable the bus terminations on the CANFDuino as detailed in the hookup guide. Take note of the CANbus wiring conventions discussed here (for monitoring a temporary small spur connection is usually no problem).
Step 4
Open ArduinoIDE, go to File->Examples->CANFDuino_CANTerm.ino. Upload the sketch to the CANFDuino.
Step 5
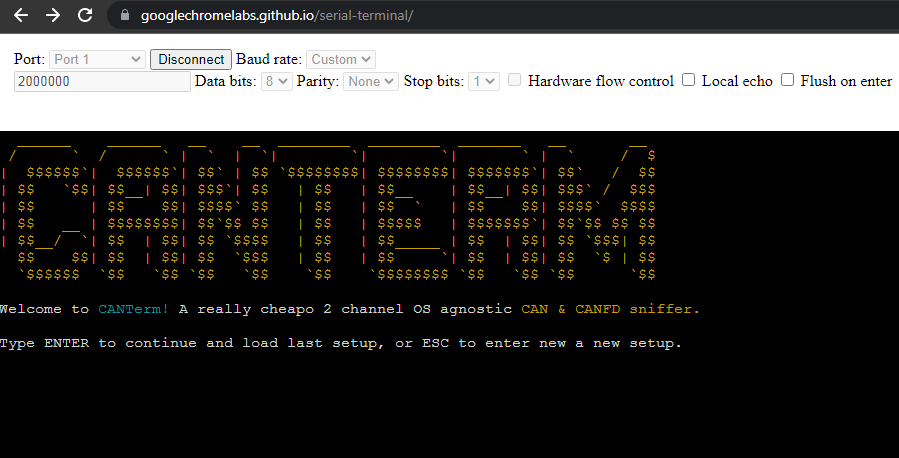
Open up the terminal program, https://googlechromelabs.github.io/serial-terminal/ . Set a custom baud rate to 2MBaud (2000000), select add COM port, pick the one assigned to CANFDuino and then click connect. Wait for a few seconds for the reboot and on-screen instructions to appear and follow them (if no on-screen instructions, check the baud rate and COM port setting and connect again). Note: if you want to avoid the boot up delay each time you open the COM port, jumper the bootloader bypass detailed in the hookup guide. Note that if you are using PuTTY, you can actually set the font sizes and line count to give you more real estate to work with if you have a ton of messages to work with.
Step 6
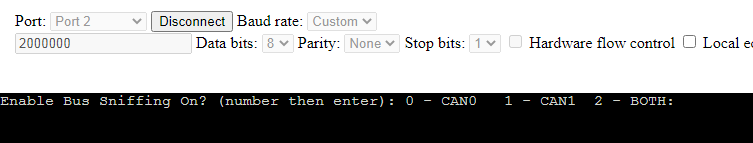
CANTerm saves settings into internal flash memory, so if you’ve already set you baud rates etc. then just press enter! If this is your first time (or you flashed CANFDuino) hit escape and follow the step by step prompts for:
Which Ports You Want to Monitor
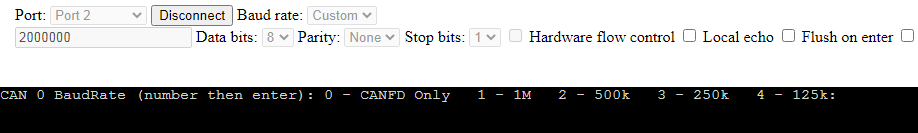
Set The Normal CAN Baudrate
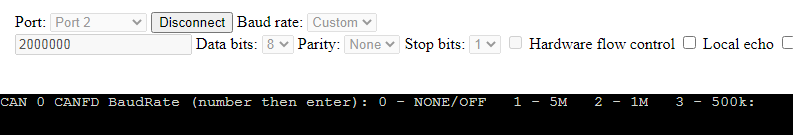
Set the CANFD Baud Rate
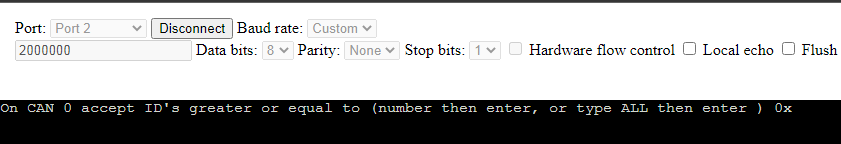
CAN ID Message Filter Setting 1
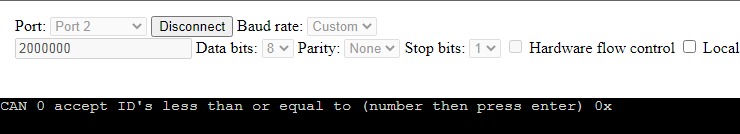
CAN ID Message Filter Setting 2
Step 5
Commence monitoring! You will see message contents listed in a static line order, with associated message counters. This display is useful for simply watching contents on the screen at naked eye speeds enabling you to see what ID’s are being transmitted and what the contents look like.

Features for Future Consideration
Dump Mode – Just dump packets to the screen for datalogging purposes and download. Note the Chrome serial terminal emulator has a “download” button to capture contents.
Binary & Decimal Mode – packet contents in decimal or binary format instead of hex
Color Coding – Turn fast changing bytes red or give them a red background, slowly changing bytes blue.
DBC File Support – Put your DBC file on the SD card for signal monitoring in the terminal window in actual engineering units e.g. “RPM”
Transmit Capability – Define packets for one-shot or periodic tranfer


